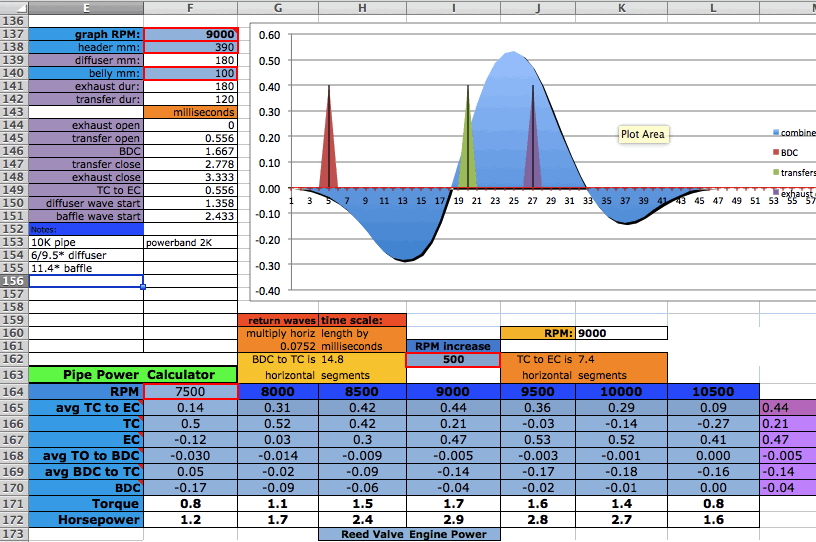
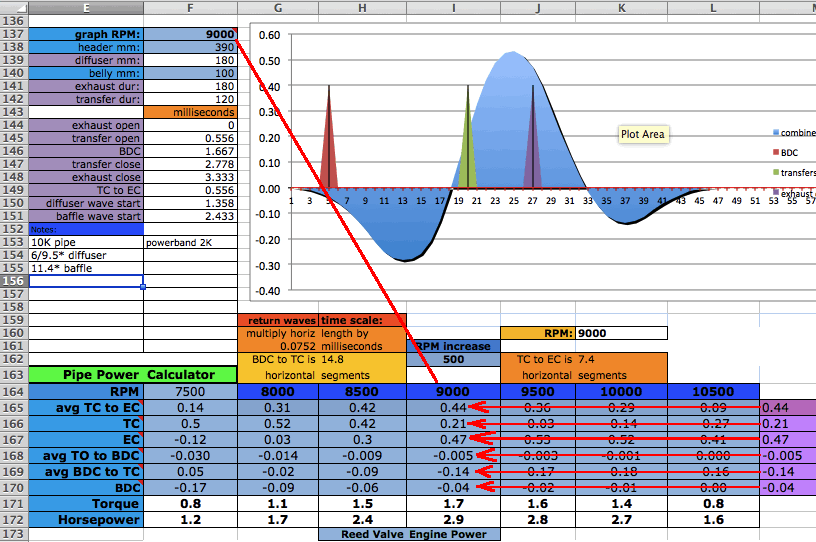
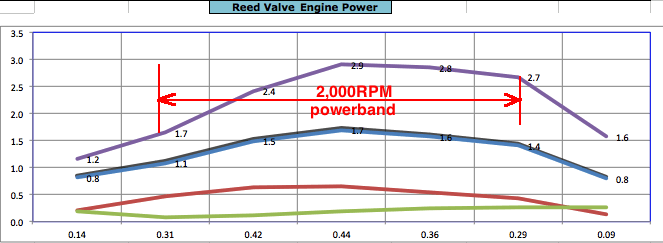
Pipe Power CalculatorThe pipe power calculator is the section below the combined waves graph. When you put in an RPM at F165 to its right will show six more RPM, each 500 more than the previous (or a different increment if you change the value at I162). Type in an RPM at F165 so that the top-of-powerband RPM + 500 is at L165. The RPM you enter at F137 will make the combined waves graph display for that RPM and the values from that graph display in the purple boxes (M166-170). The values you enter for header (F138) and belly length (F140) take precedence over the values you entered at the top of the page. Put the values displayed in the purple boxes in the boxes at the column for that RPM. Change the RPM at F137 to be 500 more (or less) and repeat for that column, entering the values in the purple boxes into the blue boxes. Keep repeating for all 7 RPM columns.  The relative boost values for that RPM will then be displayed at the base of that column and those values will be displayed in the bottom graph. This example is near perfect for a powerband from 8,000 to 10,000 RPM. The blue graph is the engine torque, the purple graph the horsepower, the green graph the contribution from the return waves at the transfers, and the red graph the contribution from the return waves at the exhaust port. The amounts are not actual but the graphs intent is to show their form. Think of this as the extra amount of power that the pipe contributes to the engine.  My best estimate so far is that the powerband is from where the horsepower is 57% of the peak (.57 x 2.9=1.65) to where the curve noticably starts to drop off. (Horsepower is just torque multiplied by RPM divided by 5252. Click here for more info.)  If the RPM range of meaty power is less than what your bike needs then you have to lengthen the baffle (by using a lesser angle or adding a baffle extension) and possibly the diffuser (with a lesser cone angle). The RPM range of the powerband depends on the left-right orientation of the peak of the baffle wave on the combined waves graph. You can change that with a different diffuser length or a different baffle design. To make the torque/hp graph peak more to the left then move the baffle wave to the right (on the combined waves graph) by just lengthening the header or diffuser. There is also a calculator/grapher for piston port intake engines. The exhaust port boost is determined by the average wave strengths from TC to EC. The horsepower graph shape mostly follows that boost shape.  |