|
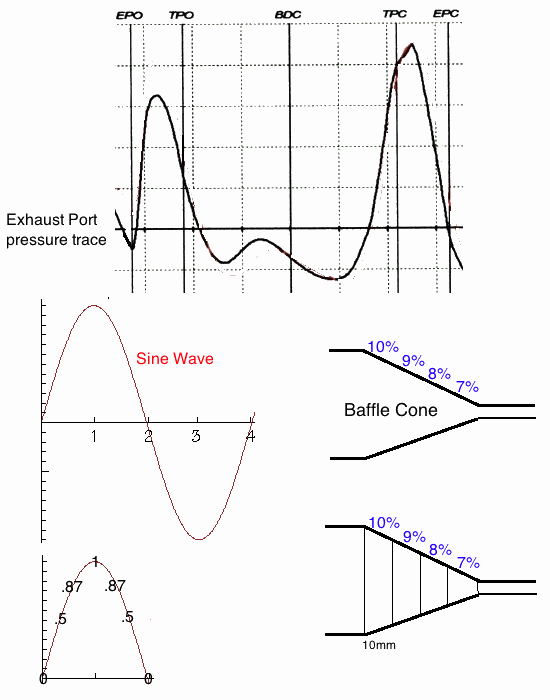
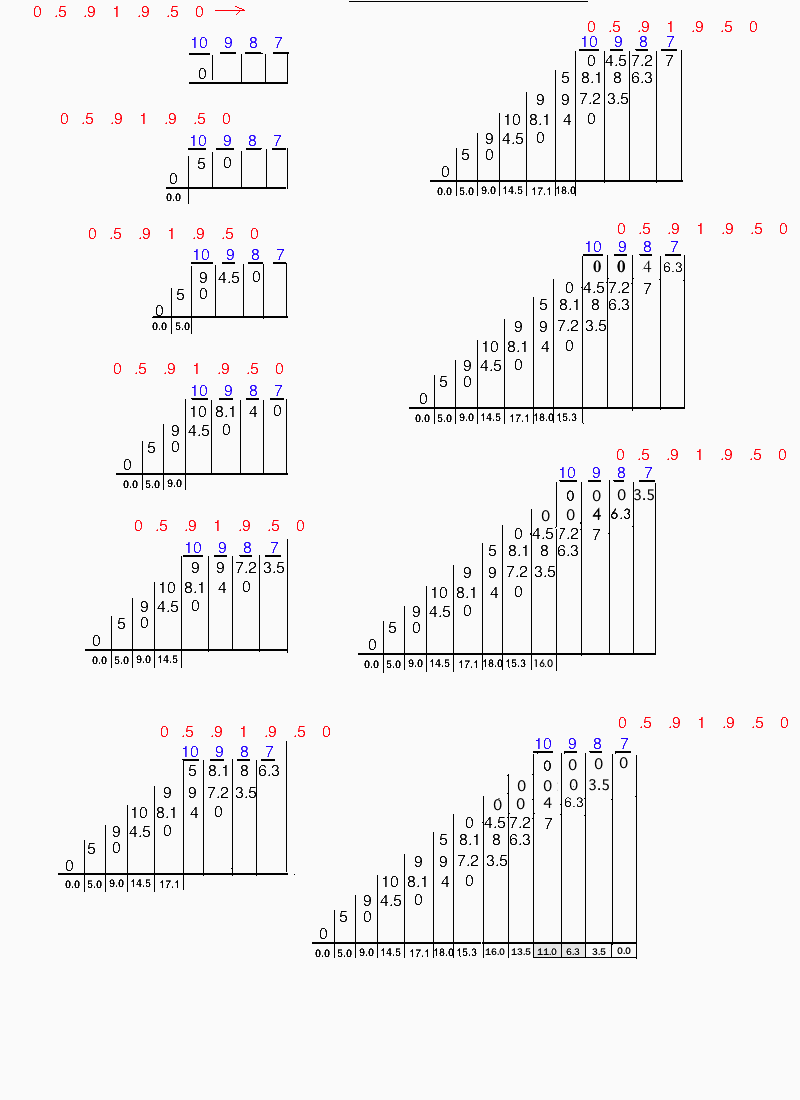
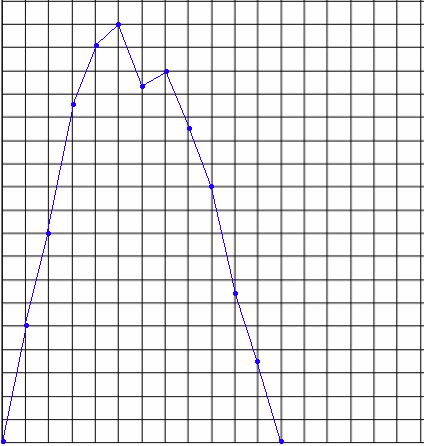
Take a look at the first positive pulse in the exhaust port pressure trace shown below. It almost looks exactly like a sine wave. It isn't a square wave due to the fact that most exhaust ports are roundish and as the piston uncovers the port the area of flow gradually increases, not all at once. Blair wrote that a pressure wave travelling in a pipe will have its peak travel a little faster than the rest of the pulse so that, given enough length, this exhaust pulse will be just like a sine wave. So I use a sine wave in my calculations to represent the exhaust pulse. At 30 degrees a sine wave has 50% strength, at 60 degrees 87%, and at 90 degrees 100%. So for the illustration example below I use these numbers to represent the varying pressures of a sine wave shaped pressure pulse: 0, .5, .9, 1, .9, .5, 0  Blair also said that the change of area along an expansion chambers cones is the cause of the return waves with more change causing more return wave strength. For illustration purposes I have depicted a baffle cone with area changes ranging from 10% to 7%. Now look at the illustration below. The red numbers are those of the exhaust pulse, and the blue numbers are the percentages of baffle cone area change. As the exhaust pulse traverses the baffle cone we will multiply the red and blue numbers to derive the black numbers below. Looking at the third step, where the exhaust pulse has reached the 30mm length of the baffle cone, we can see the return wave has the strengths of 0 and 5. At the 7th step, at top right of illustration, the return wave progresses in strength from 0 to 18. The final step is at the bottom right. Hopefully this example makes it obvious that wave strength steps are combining to make the final version of the return wave. Look at the 7th step and see how the 4th "strength" of return wave is a combination of 10 and 4.5 to result in 14.5. The next strength is 9 + 8.1 to equal 17.1. So when you want to calculate for 12 sections of exhaust pulse traveling through a 190mm long baffle cone it is just a mind-bender to try to do so without a calculator such as Excel.  The final step shows the return wave having these strength numbers: 0, 5, 9, 14.5, 17.1 18, 15.3, 16, 13.5, 11, 6.3, 3.5, 0. The graph of these numbers showing the shape and width of the return wave is shown below: 
 |