|
Here is the dyno of a customer with a 50cc engine with piston port only intake: 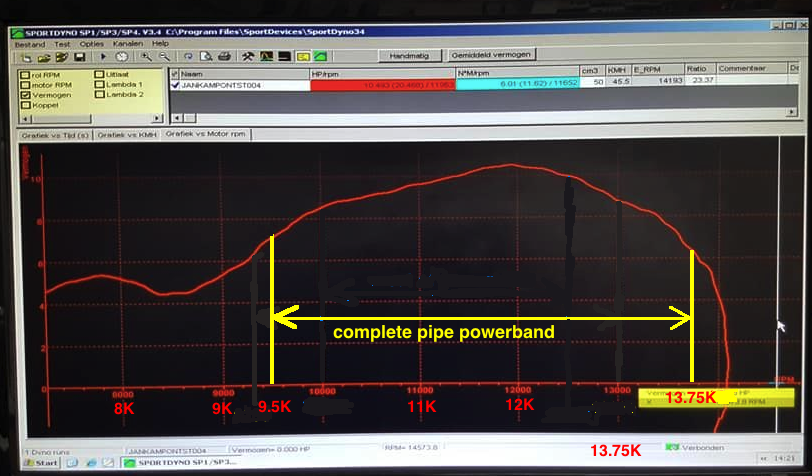 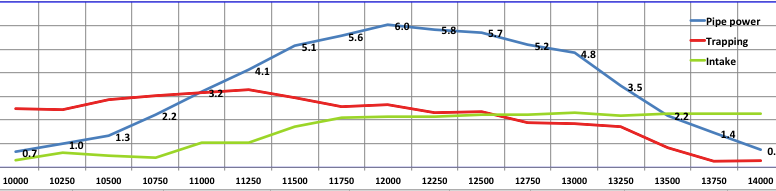 Here is a dyno horsepower graph sent to me by a customer. He built the pipe using ECcalc27. The dotted green line represents the likely engine power w/o the pipe and so the green graph above it has the added pipe power that was graphed on ECcalc. 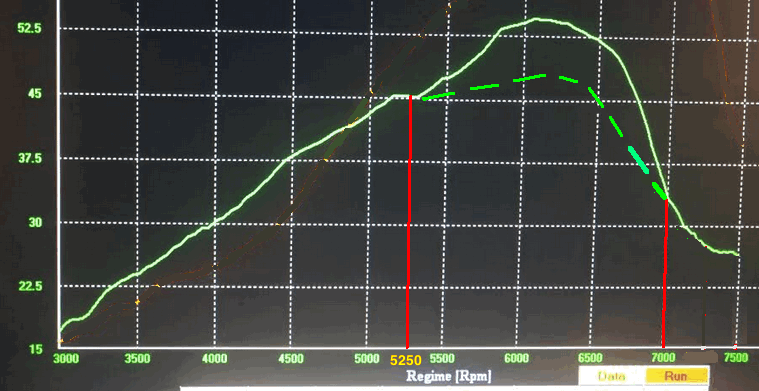 And here is the ECcalc29 graph of the pipe power : 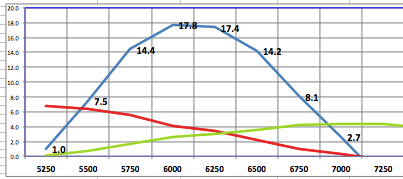 I have a research paper by Gordon Blair where he gives full engine/pipe details and horsepower graphs. So I present it here and show the graph that ECcalc29 gives with the same details. They aren't exactly the same but they are close enough. That dip in the middle of his graph is probably due to the secondary return waves which my calculator can't correctly reproduce yet. I am working on it still. I had to paste two graphs together to show it as one graph here since its powerband spread exceeded my calculators ability. Do you see the pre-powerband horsepower dip from 7000 to 8750? Pipe powerbands start right after that dip. Those dips are caused by the baffle return wave and can only be corrected by use of a boost bottle properly designed to match that RPM. 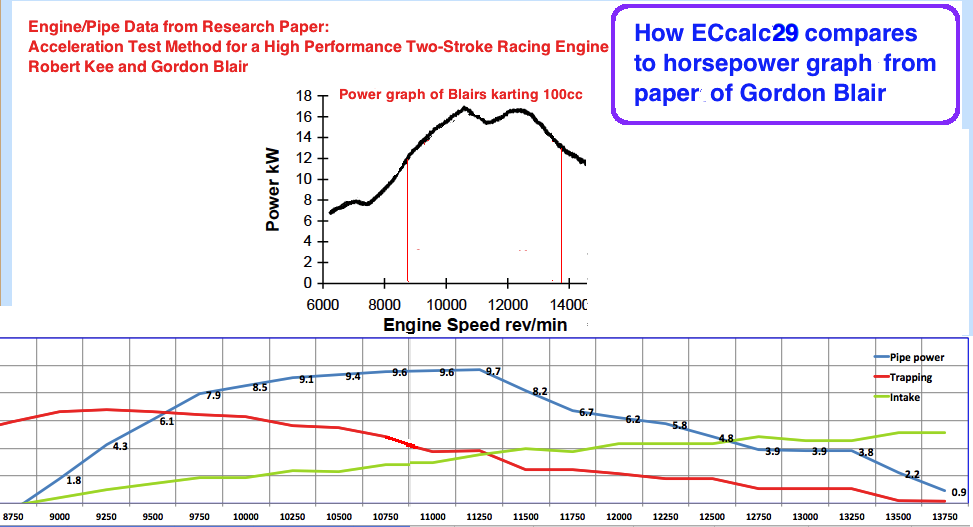 Blair also did a research paper on a Husky 250 and here's its graphs: 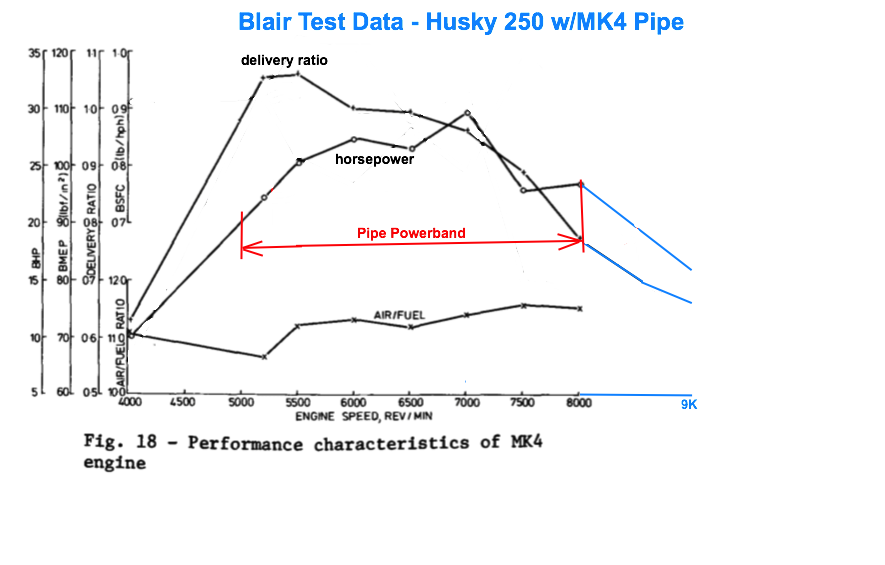 Here's the graph from ECcalc derived from the exact pipe and engine data in Blair's paper: 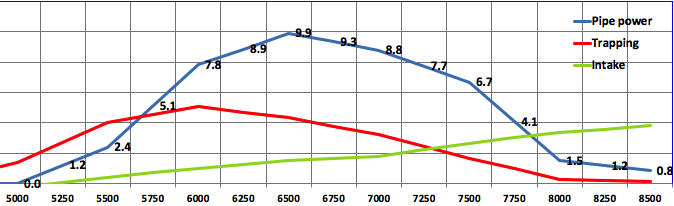 Here's the pipe on a KTM SX250 engine used in Johns racing kart :  Here's the dyno of different pipes he tried. The upper blue graph is from this pipe. 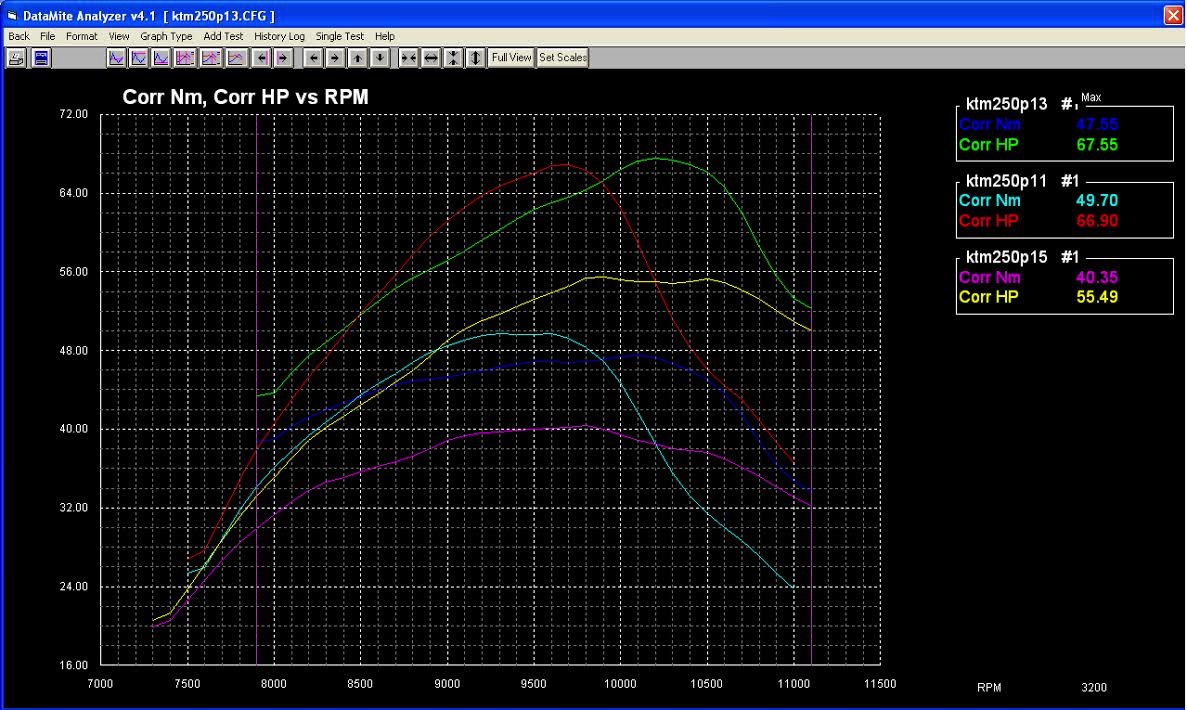 ECcalc29 pipe power graph (blue) of Johns engine/pipe. 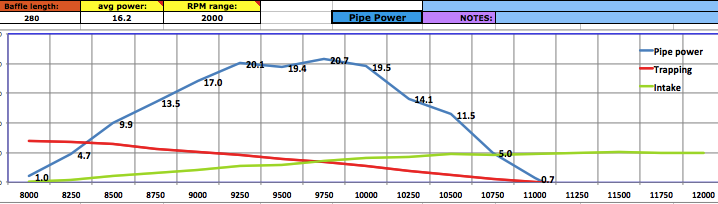
Here's the hp graph from an Aprilia RS125 bored out to 138cc, with a homemade pipe. 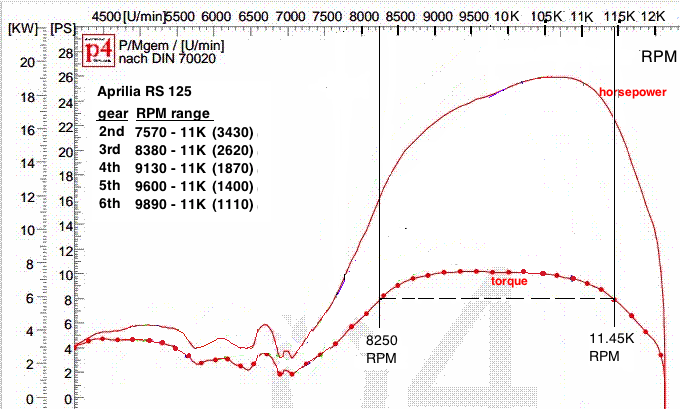 Here's ECcalc29 pipe power graph (blue) that shows the basically the same :  Click here to see how ECcalc matches the return waves pressure traces that Blair recorded. HOME |